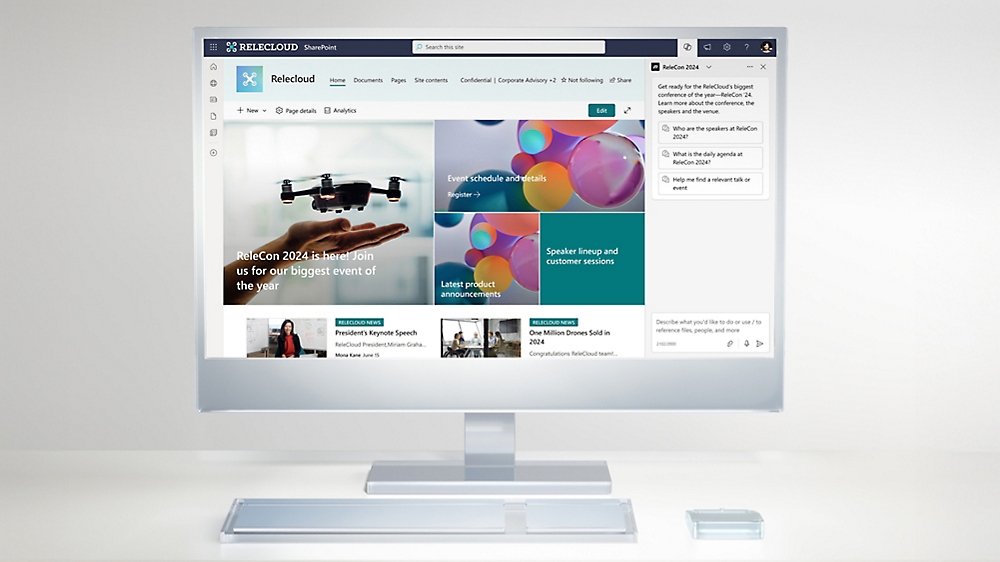
Microsoft SharePoint is a web-based collaboration and document management platform used by organizations to store, organize, share, and access information securely. It's part of the Microsoft 365 suite and integrates with other Microsoft tools like Word, Excel, Teams, and Copilot.
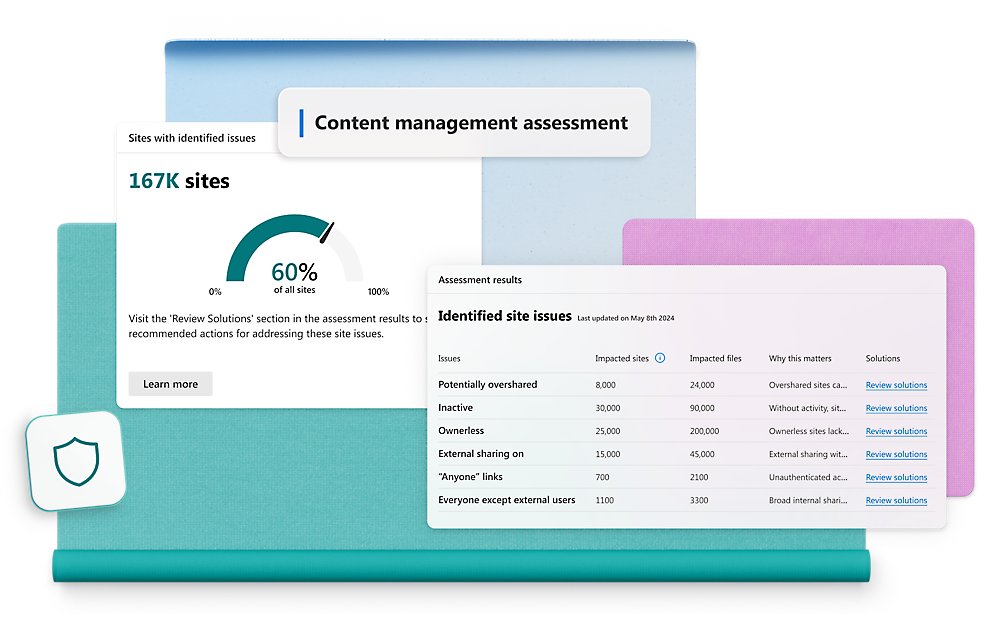
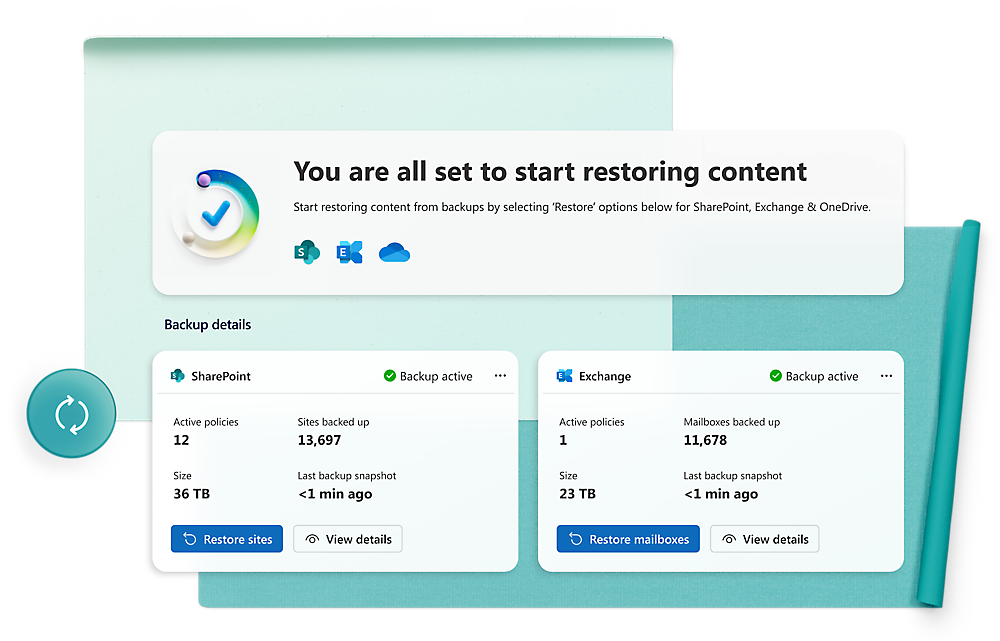
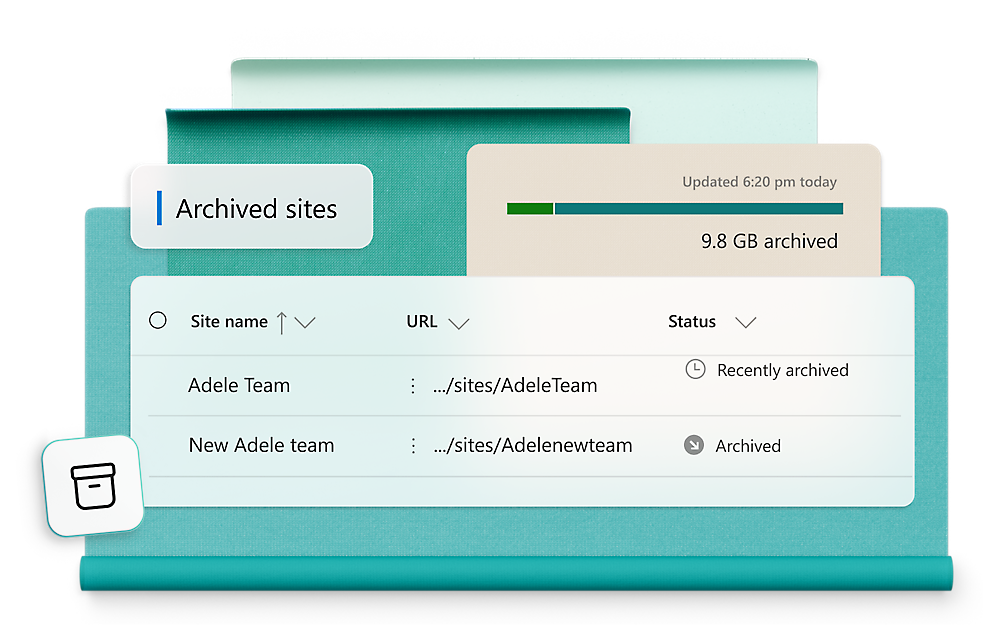
SharePoint supports content management, intranet portals, and internal communications to help streamline workflows and improve productivity.


Follow Microsoft 365